
Page loading time is one of the most important metrics for measuring website performance. The speed of a website has a significant impact on user experience, as well as search engine rankings, traffic, bounce rates and user engagement. As a direct consequence of this, one should always ensure that page loading times are always fast and optimized.
It is important to keep in mind that search engines like Google, Yandex ond Bing consider page speed to be an important ranking factor. There are several steps you can take to improve the page loading time of your website. However, in this post, I will focus on how to measure page loading times for both mobile and desktop devices and how to visualize the resulting data.
How to Measure Page Loading Times?
There are several tools you can use to measure page loading times. Most popular tools can be listed as such:
- Google PageSpeed Insights
- GTmetrix
- Pingdom
- Lighthouse
You can use the tools available above. However, most of these tools require you to buy an API or subscription if you want to test multiple pages of your website.
| URL | Performance | First Input Delay | Speed Index | First Contentful Paint | Largest Contentful Paint | Cumulative Layout Shift | Total Blocking Time | Time to Interactive |
| https://www.mfatihkaradeniz.com/gtm/tracking-http-error-codes-with-gtm/ | 94 | 0,440 ms | 0.9 s | 0.7 s | 1.0 s | 0 | 270 ms | 1.0 s |
| https://www.mfatihkaradeniz.com/gtm/how-to-use-google-tag-manager/ | 90 | 0,880 ms | 0.7 s | 0.9 s | 1.3 s | 0 | 156 ms | 0.8 s |
| https://www.mfatihkaradeniz.com/seo/e-commerce-seo-guide/ | 85 | 1,370 ms | 0.5 s | 0.6 s | 1.2 s | 0 | 260 ms | 1.1 s |
Retrieve Data From PageSpeed Insights for Multiple Pages
I have created a Python script that you can use to get important data such as in the example above from Google PageSpeed Insights for multiple pages by entering your API (includes instructions on how how to get your PageSpeed API Key).
Be sure to check it out: Bulk Page Speed Insights
However, there are several reasons why checking multiple URLs for page speed via the PageSpeed Insights API may provide less accurate data:
- The PageSpeed Insights API may report different numbers for the same URL when checked individually.
- Server load of PageSpeeds can affect the time it takes for a web page to load, and the server load can vary at different times of the day depending on the request traffic. This may result in inaccurate data.
- The PageSpeed Insights API may report different numbers due to caching behaviour of a given page . A previously visited URL, may have cached some of the resources, which can make the page load faster. However, the PageSpeed Insights API may not have access to the cached resources, resulting in a longer loading time.
- The PageSpeed Insights API has a limit on the number of requests that can be made you can make up to 400 queries every 100 seconds or 25,000 a day. If you exceed the given limit, you may receive incomplete or inaccurate data.
This is why we’ll try a different method to get accurate page loading page times for our data.
How to Measure Page Loading Times for Multiple Pages – Mobile/Desktop With Python
In this post I’ll be using a Python script to measure page loading times both for mobile and desktop devices. In order to do that let’s hit the link below.
—–>>> Page Load Time Analysis & Visualization Tool <<<—–
As the “How to Use?” instructions specify, you should click ‘▶’ to run the code. It may give a “Warning: This notebook was not authored by Google”. Click “Run Anyway” and continue. However, if you do not want to do that. You can copy the code and run it in your own Google Colab space

The next step is to enter your sitemap. I’ve added a progress bar that shows how many urls are left and how long it’ll take for the code execute completely.

After the code finishes running completely. Images are printed that visualize the page loading time data in Python’s Seaborn and Matplotlib. I’ve arranged it so it prints images in Groupes per 75 URLs. This means that if you have 150 URLs in your sitemap the script will produce 2 different Images for your sitemap. In this way you can more clearly see the page loading times of each URL both for mobile and desktop and see which pages are slower/faster as well as the mobile/desktop page loading time disparities.
View Page Load Speed Discrepancies Between Desktop and Mobile via Looker Studio
As stated in the code description, the file is uploaded as ‘page_load_times.csv’ and to download it you can click 📁 on the left, right-click and and refresh and see ‘page_load_times.csv’ file and right click again to download the file.

In order to connect it to Looker Studio, let’s first navigate to Looker Studio: lookerstudio.google.com and Choose ‘Blank Report’

Click ‘File Upload’ and upload “page_load_times.csv” that you’ve downloaded and add it to Looker Studio.
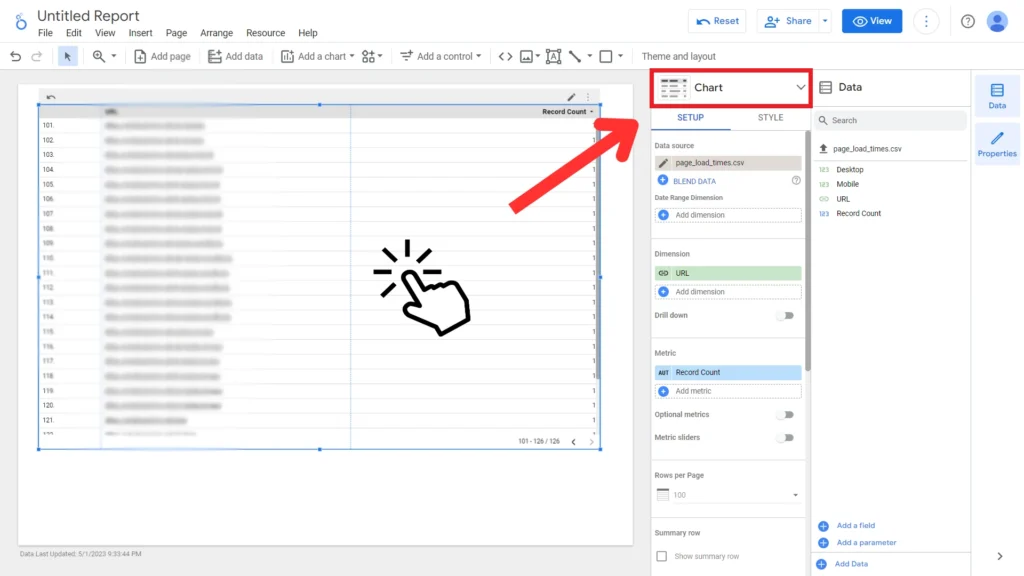
Now you should click the exported table and Click ‘Chart’

From the new opened tab you should choose ‘Line Chart’ as the arrow points out in the image above.
In the ‘Metric’ section below, remove ‘Record Count’ and add ‘Mobile’ and ‘Desktop’ as a metric. The graph will now show a chart on which you can determine the page loading speeds of URLs for mobile as well as desktop. In this way it’ll be much easier to determine the discrepancies between mobile and desktop loading times and implement changes where it’d be necessary.
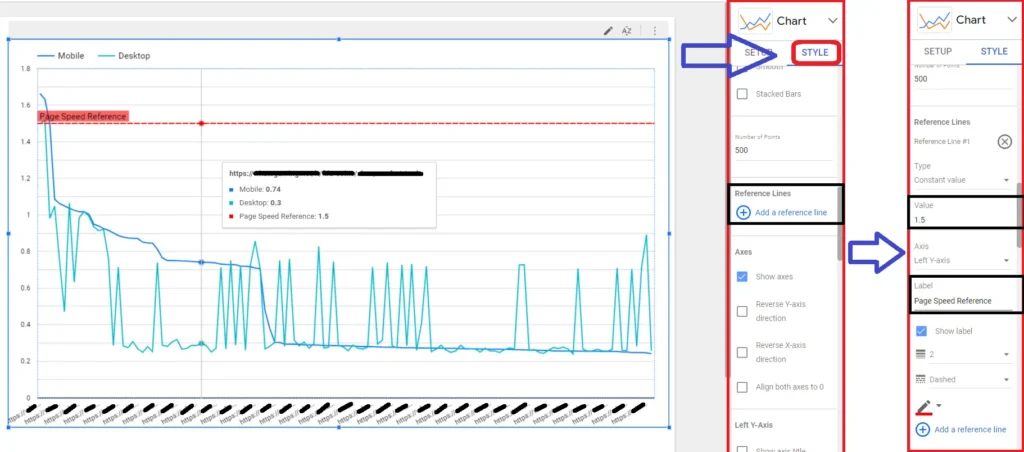
If you want to add a reference line to the graph to determine a sort of page speed limit reference, you can click “Style” in below chart line like in the given image above. Then scroll down to add a Reference Line. For the next steps you can attain a value according to your page speed reference standarts.
See other Python SEO Tools:
FAQs about Page Loading Time
Why is page loading time important for website performance?
Page loading time is crucial for website performance because it affects user experience, search engine rankings, traffic, bounce rates, and user engagement. Slow page load times can increase the probability of a bounce, hurt your ability to drive engagement and conversions, and negatively affect your brand perception. Therefore, it is essential to ensure that your pages load within a few seconds.
How can I improve page loading time for my website?
There are several quick ways to improve page loading time, such as choosing a performance-optimized hosting solution, compressing and optimizing your images, reducing your redirects, and caching your web page. Additionally, you can improve page speed by minimizing the distance data travels, optimizing your website’s server speed, simplifying your code, reducing your page file size, and using a faster connection type.
What is page speed, and how is it measured?
Page speed is the amount of time it takes for a webpage to load, measured by the interval between a browser requesting a webpage and when the browser renders the page. Page speed is influenced by various factors, such as the distance data travels, the website’s server speed, the complexity of its code, the page file size, and the connection type.
Other Articles

